
Python命令行画图
Python命令行画图
当你没有GUI时,你需要在命令行画图,我们介绍三个比较有意思的python模块: bashplotlib,emoji,Termgraph,我们会依次介绍这三个比较有意思的与命令行画图相关的模块。
bashplotlib
安装
$ pip install bashplotlib
# 或者安装开发版本
$ git clone git@github.com:glamp/bashplotlib.git
$ cd bashplotlib
$ python setup.py install
命令行画图
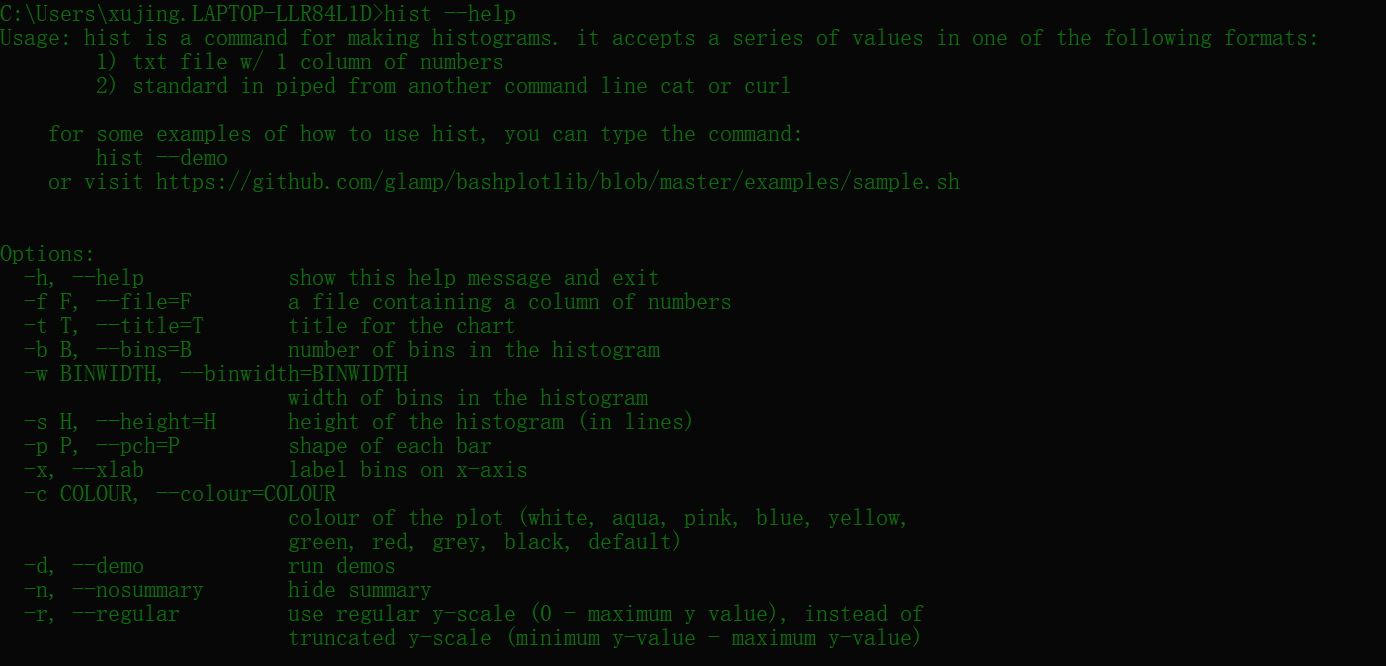
- hist的参数说明
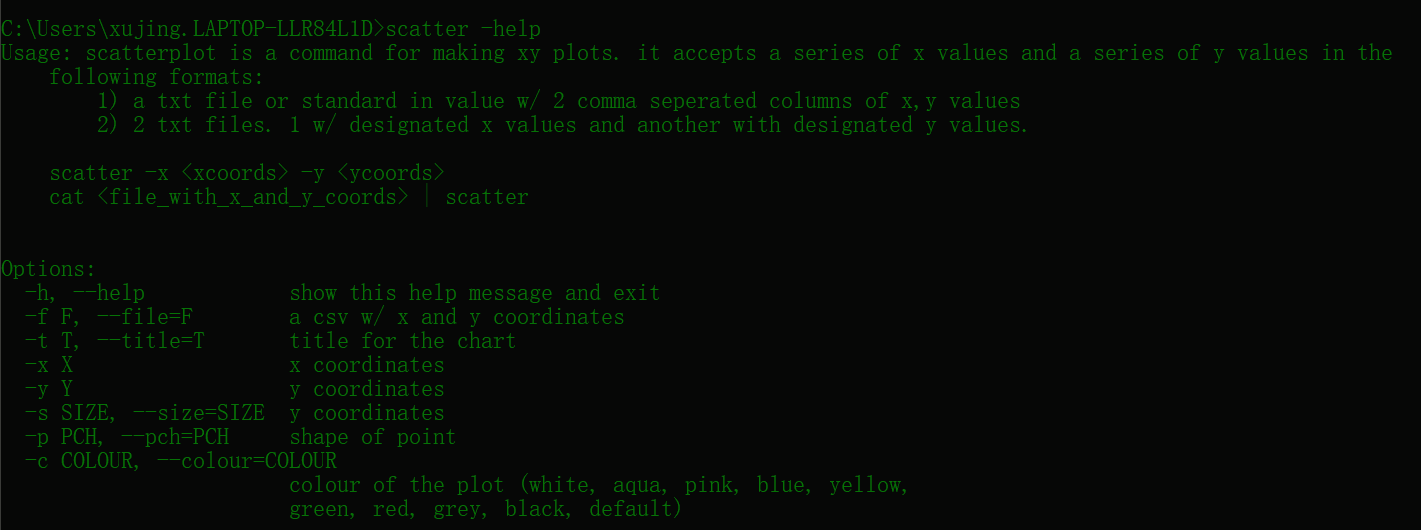
- scatter参数说明
Python中绘图
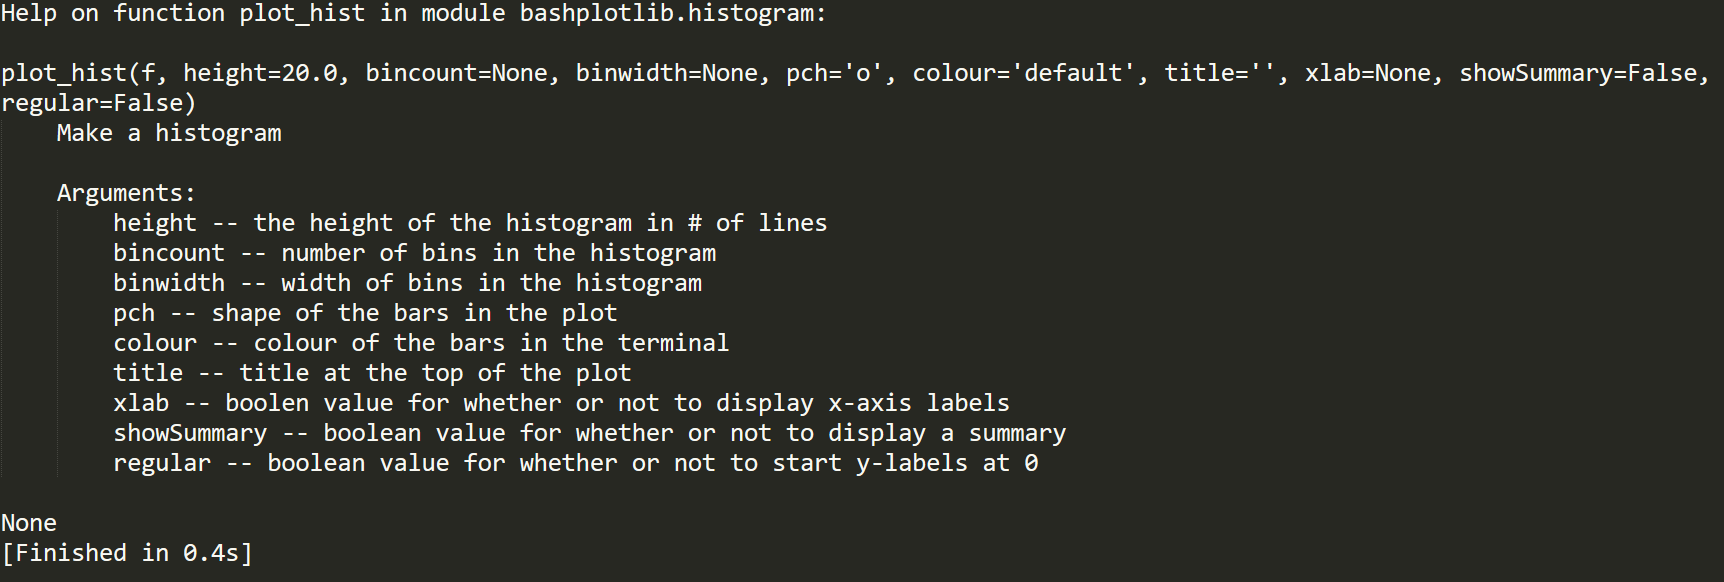
from bashplotlib.histogram import plot_hist
print(help(plot_hist))
from bashplotlib.scatterplot import plot_scatter
print(help(plot_scatter))
emoji
安装
$ pip install emoji --upgrade

$ git clone https://github.com/carpedm20/emoji.git
$ cd emoji
$ python setup.py install

#开发版本的安装
$ git clone https://github.com/carpedm20/emoji.git
$ cd emoji
$ pip install -e .\[dev\]
$ nosetests
例子
>> import emoji
>> print(emoji.emojize('Python is :thumbs_up:'))
Python is 👍
>> print(emoji.emojize('Python is :thumbsup:', use_aliases=True))
Python is 👍
>> print(emoji.demojize('Python is 👍'))
Python is :thumbs_up:
参考
termgraph
安装
pip install termgraph
[root@clzx test]# termgraph -h
usage: termgraph [-h] [--title TITLE] [--width WIDTH] [--format FORMAT]
[--suffix SUFFIX] [--no-labels]
[--color [{red,blue,green,magenta,yellow,black,cyan}
[{red,blue,green,magenta,yellow,black,cyan} ...]]]
[--vertical] [--stacked] [--different-scale] [--calendar]
[--start-dt START_DT] [--custom-tick CUSTOM_TICK]
[--delim DELIM] [--verbose] [--version]
[filename]
draw basic graphs on terminal
positional arguments:
filename data file name (comma or space separated). Defaults to
stdin.
optional arguments:
-h, --help show this help message and exit
--title TITLE Title of graph
--width WIDTH width of graph in characters default:50
--format FORMAT format specifier to use.
--suffix SUFFIX string to add as a suffix to all data points.
--no-labels Do not print the label column
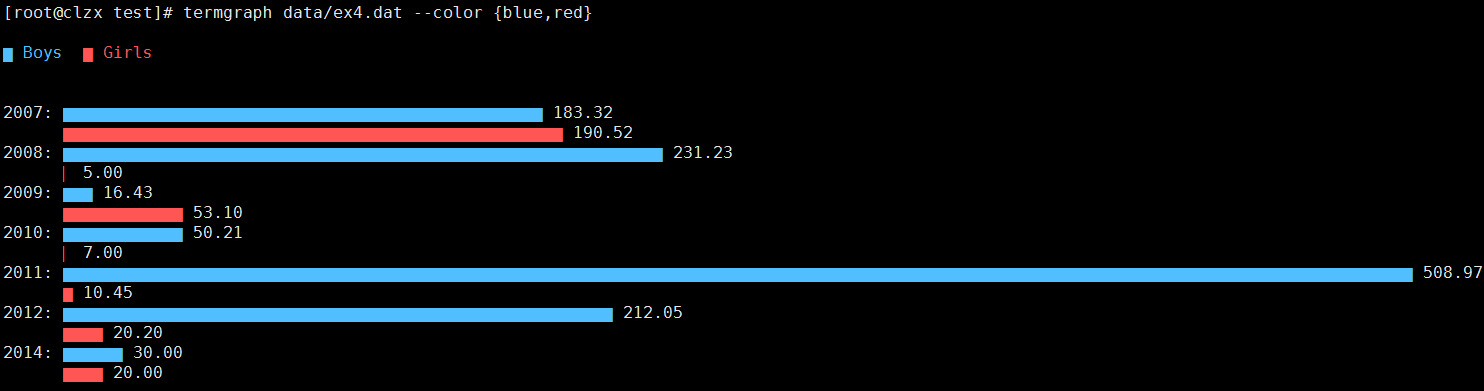
--color [{red,blue,green,magenta,yellow,black,cyan}
[{red,blue,green,magenta,yellow,black,cyan} ...]]
Graph bar color( s )
--vertical Vertical graph
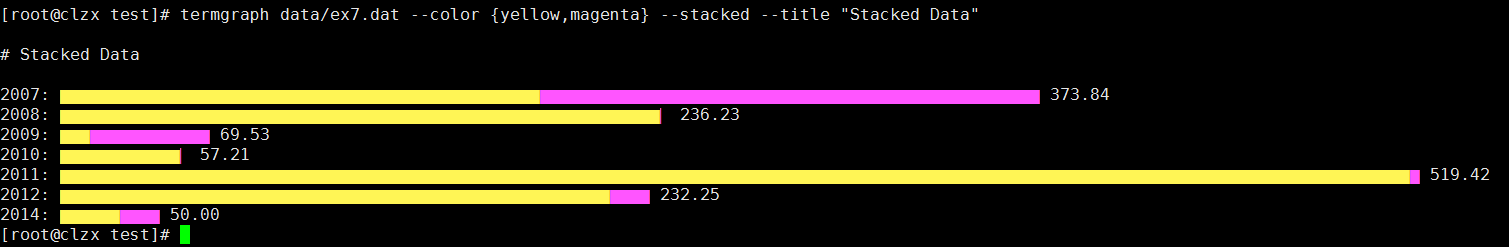
--stacked Stacked bar graph
--different-scale Categories have different scales.
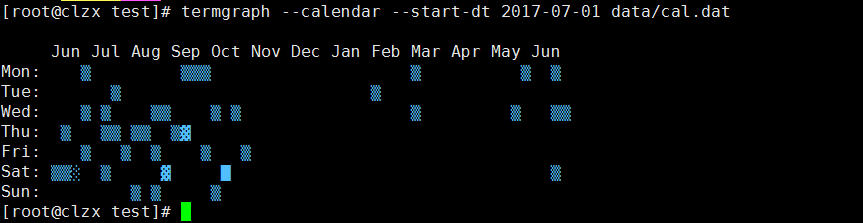
--calendar Calendar Heatmap chart
--start-dt START_DT Start date for Calendar chart
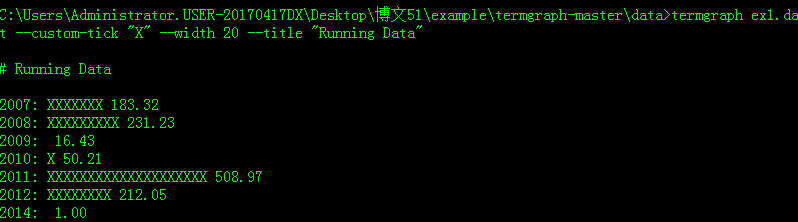
--custom-tick CUSTOM_TICK
Custom tick mark, emoji approved
--delim DELIM Custom delimiter, default , or space
--verbose Verbose output, helpful for debugging
--version Display version and exit
目前支持的图形包括:
- Bar Graphs
- Color charts
- Multi-variable
- Stacked charts
- Horizontal or Vertical
- Emoji
例子
参考